

Hi candidate,
This is your interview question.
Duration: 1 hour for 2 questions.
Question 1. Province-aligned cell clipping on Vietnam mainland
Definition: A cell is a grid location represented by its centroid, with resolution 30 x 30 km; in cells.csv each row is one point with columns C_ID, Latitude, Longitude in WGS84.
Input Data:
cells.csv: a list of grid centroids for 30 x 30 km cells. It is used for creating points and each row is the center of each cell.
vn_mainland.shp: polygon/multipolygon for the mainland, while each row is polygon/multipolygon for each province (63 rows overall).
paracel.shp: polygon of Paracel Islands (Quần đảo Hoàng Sa).
spratly.shp: polygon of Spratly Islands (Quần đảo Trường Sa).
coastline.shp: linestring of the shoreline.
Question 2. Coding (visualization + data wrangling)
Quick network map
Plot all substations and draw both 500 kV and 220 kV lines on top of the Vietnam shapefile map. Use different line widths for voltages and a subtle symbol change for connected vs isolated substations.Voltage-aware symbology
Symbol size by Max_hosting_MW_2030; color by Voltage_kV.Lifecycle overlay
Map substations with life_expectancy_years ≤ 5 and emphasize any that sit on paths connecting major components (critical aging assets).Mismatch diagnostics
Visually flag lines whose endpoints failed to match a substation coordinate/name (if any).Distance sanity
Compare provided Distance (km) to geodesic distance from endpoint coordinates. Plot a histogram of residuals and flag outliers.Interactive filter
Build a small interactive (or scripted) view: toggle 500 kV/220 kV; filter by developer; slider for Max_hosting_MW_20xx.
Assumptions about hierarchy & how to fill blanks
Grid hierarchy model
Describe your working assumptions about Vietnam’s transmission hierarchy (500 kV backbone → 220 kV sub-transmission → 110 kV/medium voltage). If there are missing lines (existing substations with no connections), what are your assumptions to fill in the missing data? Describe your strategy for filling in the blanks.Capacity proxying
If line capacities are lacking, propose a proxy using voltage, Circuits x km, conductor assumptions, and typical MVA per circuit—state your ranges and uncertainty.
Hosting potential
Use Max_hosting_MW_2025/2030/2035 to infer growth corridors. What interpolation/extrapolation would you apply? How do you guard against over-fitting to toy values?
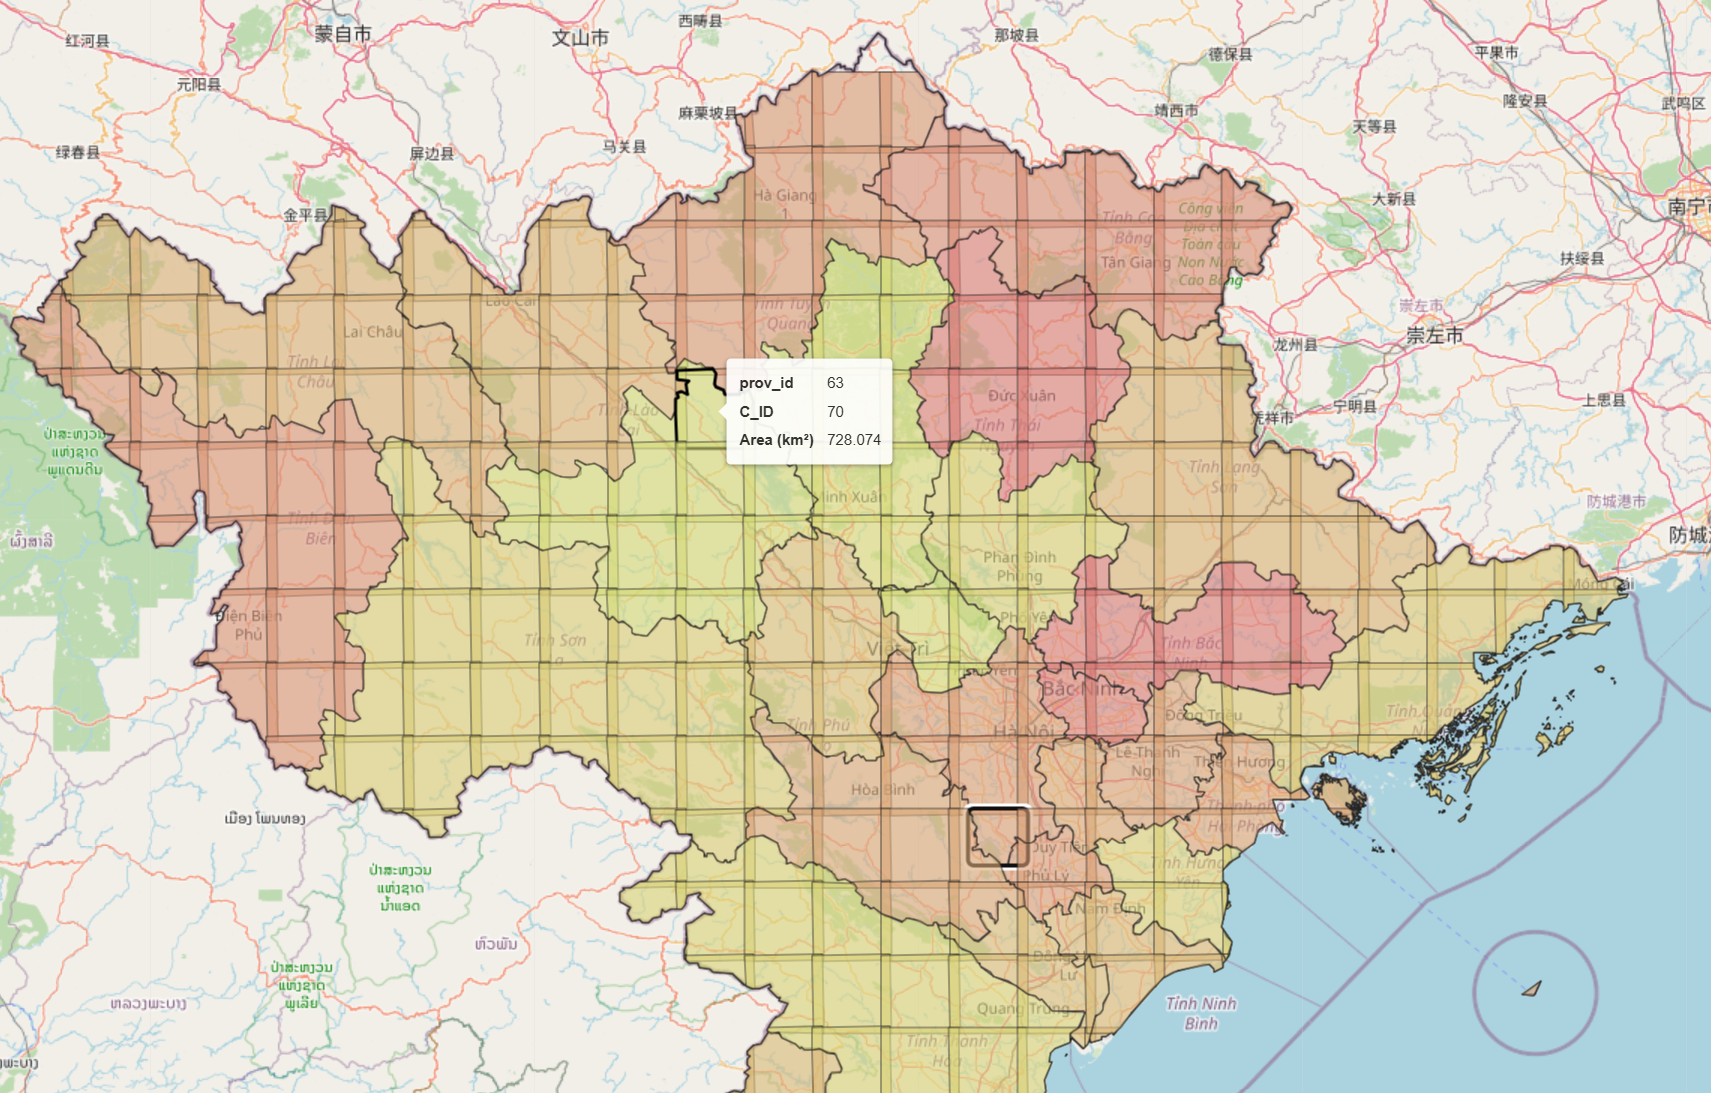
Given cells.csv with C_ID, Latitude, Longitude in WGS84 (each row is the centroid of a 30×30 km grid cell) and a province-level Vietnam shapefile plus the mainland boundary:
Construct a 0.25 x 0.25 degree (~30 x 30 km) square polygon around each centroid using a meter-based CRS of your choice.
Clip these polygons to the Vietnam mainland, intersect them with province boundaries so that any cell crossing multiple provinces is split into separate features tagged with C_ID and province (in VN mainland shapefile),
Compute the area (km²) for every resulting piece, export a geospatial dataset (e.g. GeoPackage/GeoJSON) of all province-clipped cell pieces and a province summary CSV aggregating total area and the count of distinct contributing C_IDs per province (= number of original cells in that province).
Produce an interactive map overlaying the mainland outline, province boundaries, original centroids, and the province-clipped cell polygons (colored by province); briefly justify your projection choice.
Hint:
Read file: pandas for CSV, geopandas.read_file for SHP.
Clip to mainland: gpd.overlay(cells_squares, mainland, how="intersection"). Drop empty results; these were fully offshore.
Intersect with provinces: gpd.overlay (clipped_squares, provinces, how="intersection"), carry C_ID and province id (= index of table).
Using geom.area/1e6 to compute area (km2).
Create interactive map with package Folium - add mainland outline, province boundaries, original centroids (center of the cell), and the province-clipped cell polygons (style by province, add LayerControl).