

Hi candidate,
This is your interview question.
Duration: 1 hour for 2 questions.
Question 1. Distance to Vietnam’s coastline
Definition: A cell is a grid location represented by its centroid, with resolution 30 x 30 km; in cells.csv each row is one point with columns C_ID, Latitude, Longitude in WGS84.
Input Data:
cells.csv: a list of grid centroids for 30 x 30 km cells. It is used for creating points and each row is the center of each cell.
vn_mainland.shp: polygon/multipolygon for the mainland. Used for determining whether a cell is on land or at sea.
paracel.shp: polygon of Paracel Islands (Quần đảo Hoàng Sa).
spratly.shp: polygon of Spratly Islands (Quần đảo Trường Sa).
coastline.shp: linestring of the shoreline.
Task:
Compute each cell’s signed distance to the Vietnam mainland coastline:
Negative on land (mainland), positive at sea (for visualization).
Use only mainland coastline when computing distance and remove small offshore islands (sea cells) from the coastline. Just keep a mainlanded-only coastline.
Flag cell_gt_100km = True for cells with positive signed distance > 100km.
Define 6 nautical miles from the mainland coastline.
Flag nearshore_6nmi = True for sea cells (positive distance) with signed_distance_m <= 6 nm.
On the interactive map, nearshore cells must be highlighted in light blue.
Hint:
Read file: pandas for CSV, geopandas.read_file for SHP.
Geometry & distance: shapely (within, distance, unary_union).
Interactive map: folium (GeoJson, CircleMarker, LayerControl).
Distance logic: set negative if the point is within the land polygon, positive otherwise when you visualize it on map; then cell_gt_100km = (signed_distance_m > 100000) & (positive_cells).
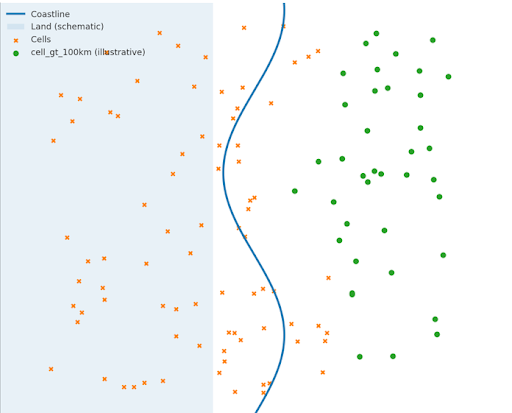
Target Visualization: (sample image)
Question 2. Coding (visualization + data wrangling)
Quick network map
Plot all substations and draw both 500 kV and 220 kV lines on top of the Vietnam shapefile map. Use different line widths for voltages and a subtle symbol change for connected vs isolated substations.Voltage-aware symbology
Symbol size by Max_hosting_MW_2030; color by Voltage_kV.Lifecycle overlay
Map substations with life_expectancy_years ≤ 5 and emphasize any that sit on paths connecting major components (critical aging assets).Mismatch diagnostics
Visually flag lines whose endpoints failed to match a substation coordinate/name (if any).Distance sanity
Compare provided Distance (km) to geodesic distance from endpoint coordinates. Plot a histogram of residuals and flag outliers.Interactive filter
Build a small interactive (or scripted) view: toggle 500 kV/220 kV; filter by developer; slider for Max_hosting_MW_20xx.
Assumptions about hierarchy & how to fill blanks
Grid hierarchy model
Describe your working assumptions about Vietnam’s transmission hierarchy (500 kV backbone → 220 kV sub-transmission → 110 kV/medium voltage). If there are missing lines (existing substations with no connections), what are your assumptions to fill in the missing data? Describe your strategy for filling in the blanks.Capacity proxying
If line capacities are lacking, propose a proxy using voltage, Circuits x km, conductor assumptions, and typical MVA per circuit—state your ranges and uncertainty.
Hosting potential
Use Max_hosting_MW_2025/2030/2035 to infer growth corridors. What interpolation/extrapolation would you apply? How do you guard against over-fitting to toy values?